

Types of Matrix
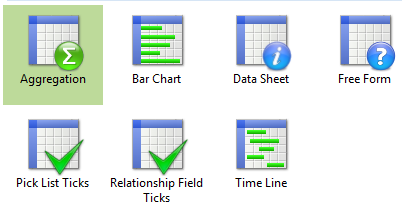
There are 7 different types of Matrices:
Datasheet Matrix
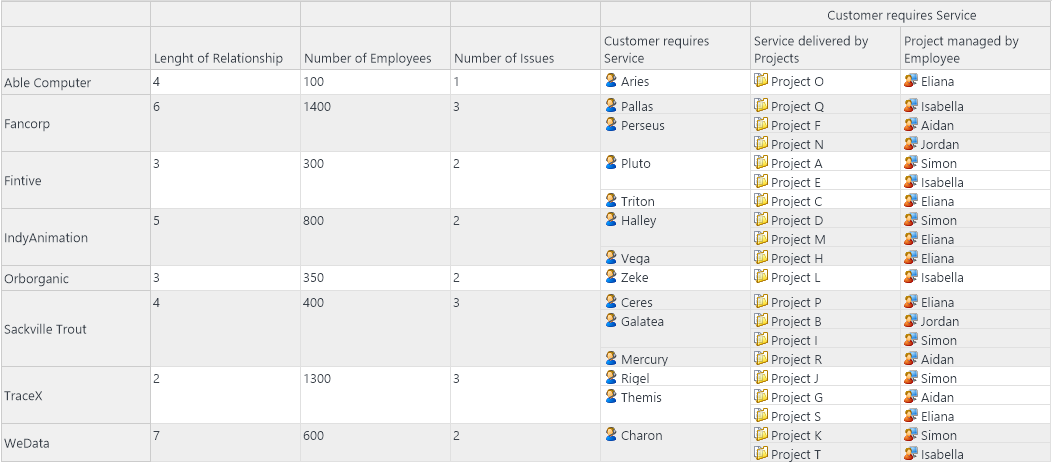
Datasheet Matrices are considered the simplest type of Matrix as they can only be used to display columns of existing information.
The example contains Customer Information in a Datasheet matrix format. The first two columns display number field values for each row element. The third column is a smart column which returns the number of issues each customer (row element) has. The fourth column populates the row elements with the Services related to the customer, using the relationship “Customer requires Service”. A further two relationships are used in sub-columns to the “Customer requires Service” column.
Aggregation Matrix
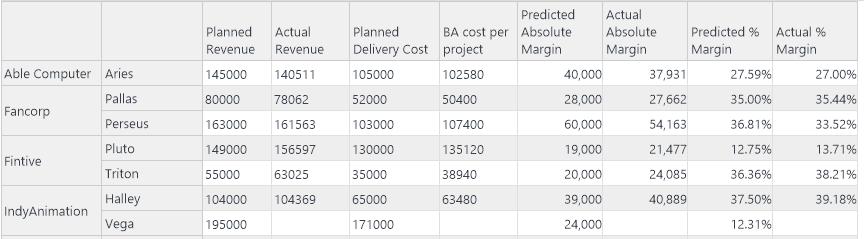
Aggregation Matrices can perform calculations on Elements in multi-dimensional views and groupings. The total values produced from these views can be used to summarise, analyse, and compare data. For more information on Aggregation Matrices see Aggregation Matrix.
This example uses three numeric fields and a cached smart column (BA cost per project) for the first 4 field columns in the matrix. The last four columns make use of facts to calculate both the percentage and absolute values for the predicted and actual margins.
Bar Chart Matrix
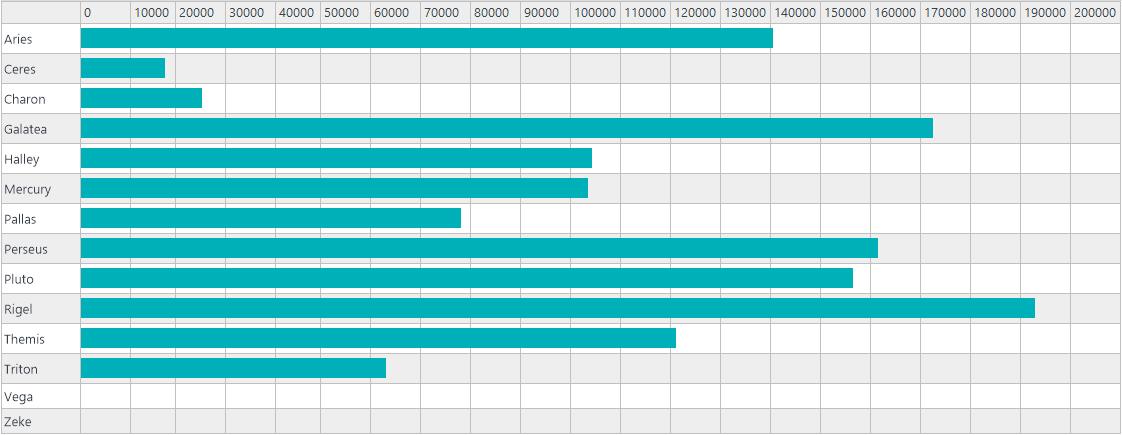
Bar Chart Matrices display numeric information for Elements. Elements appear as rows, and the columns show a progression of values.
In this example, a Bar Chart Matrix displays the Services as the row elements and shows the Actual Revenue (a numeric value) for each of the Elements.
Free Form Matrix
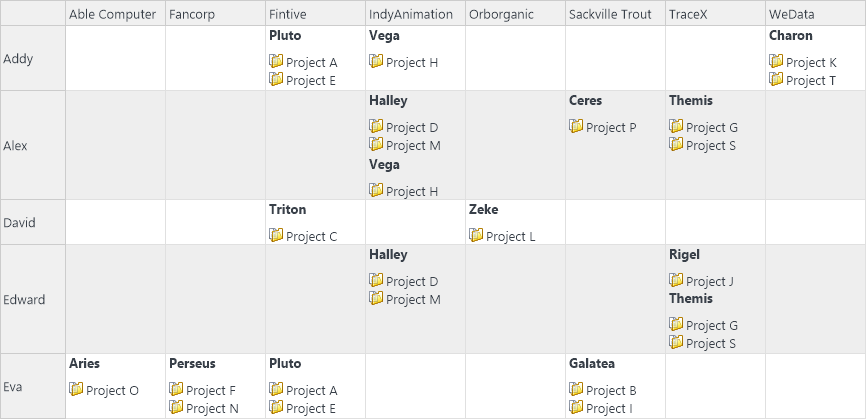
Free Form Matrices use multiple Queries to structure a Matrix in a less conventional way. Elements are used for both the row and column headings, whilst the cells show how they are related. Extra information can be included in the cells about either of the related Elements.
For example, this matrix shows the Services (e.g. Pluto, Vega etc.) worked on by Employees against Customers, using multiple relationships. Additionally, the matrix shows the projects the employee works on for each Service that appears in a cell of the matrix.
Pick List Ticks Matrix
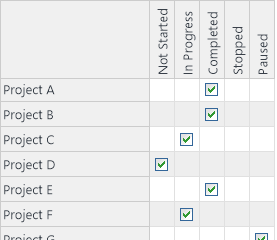
Pick List Ticks Matrices display Pick List items for a list of Elements and ticks to represent which item is selected per Element. You can alternatively configure the matrix to display icons instead of ticks.
For example, a matrix displays projects as row elements and columns show a pick list that defines the projects status.
![]()
Relationship Field Ticks Matrix
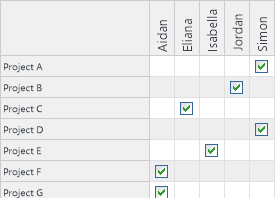
Relationship Field Ticks Matrices display Elements on both the X and Y axes, and shows, by means of a Query, if they are related.
For example, this matrix shows projects as row elements and managers as column elements. The matrix then shows how pairs or Elements are related by a Relationship Tick field.
Timeline Matrix
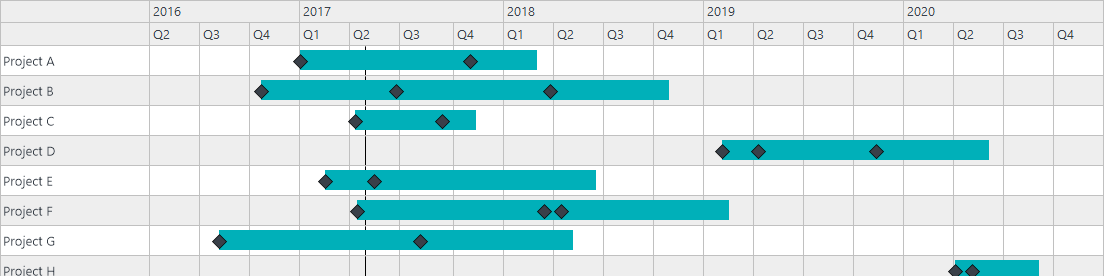
Timeline Matrices display time related information for Elements. You can include bars between dates, milestones, dependency lines and date markers. You can also add a Datasheet type column to a Timeline Matrix.
For example, this matrix shows each project’s start date and end date linked together with a bar. Milestones have been used to indicate when a new activity has been started for each project. A date marker for “today’s date” has also been added.
Comments
1 comment
Hi,
My Pick List Tick matrix is read only, I can't tick anything.. How can I change that?
Thanks
Please sign in to leave a comment.