
Note: This article mentions MooD 15, and Oracle repositories, and is somewhat out of date, but the core principles are the same in MooD 16.
About aggregation performance
Aggregations (matrices and Smart Columns) are used throughout MooD to display calculated results in tables and Info panels, and to drive charts. Their performance has a significant impact on page load times and general operating performance. You can affect performance at two key stages:
- The aggregation design and creation phase.
- The implementation phase.
Maximum benefits can be achieved if you follow the guidance in this document from the outset. However, if you have existing aggregations, you may be able to improve their performance by fine tuning their implementation through features such as execution methods and caching.
Best practice is covered later, but it is useful to understand from the outset what features MooD has to help you maximise performance. The first two are the most important:
- Caching – result sets can be generated, stored and reused. Although you can set the lifespan of the cache and manage it directly using a synchronizer, caching is only suitable when you know that the cache will remain valid for its lifespan. However, caching is the best way to improve performance and should always be considered.
- Execution methods – the way MooD creates the code that is used to generate the aggregation. By default, MooD selects what it considers the best method, but you can override this. The Performance Report helps you choose.
- The Use Fact Values Cache setting – whether to use a temporary table to store values used within facts before those values are then used to generate the actual aggregations. The Performance Report can help you determine whether this will be beneficial.
- Aggregation SQL – for advanced use only under guidance from MooD International. This lets you replace the MooD generated SQL with your own SQL. Generally, you will not use this for performance purposes, but it is a possibility.
There are several ways to test aggregations – some specifically for aggregations and some more general. These are outlined in the next section.
All of these features and settings are on the ribbon. Smart Columns have a reduced set, for example, you cannot cache Smart Columns.
Testing aggregations
MooD includes the following test facilities specifically for aggregations:
- The Matrix Performance Report (the Performance Report command on the ribbon). This is probably the most useful report for testing Aggregation matrix performance as it lets you compare execution methods, and find out what Aggregation matrices are not cached. It was introduced in Build 60 and is documented on page 25 within the Execution methods section.
- For Aggregation matrices with caching enabled, the Cache Reports (the Matrix Cache Report and Global Cache Report commands on the ribbon). These are documented on page 19 within the Aggregation matrix caching section.
These are complemented by these general test features:
- The Timings Report (the Timings command on the ribbon) shows you the timings within an aggregation allowing you to identify bottlenecks. See The Timings command and the Timings Report next for details.
- The Query Reports (generated from the cog icon on the Queries pane) show you general query performance across your repository (aggregations are run as queries and are therefore included). See The Query Reports section (page 8) for details.
Together with the general user experience of performance, these testing features give you ample means of evaluating and understanding any performance issues and areas that should be investigated. In all cases, you should test with representative data and variables.
Across all reports, look for oddities such as stages that take too long in comparison to other stages or aggregations. Also look out for spurious variables as these can be pointers to inefficiencies in your underlying queries.
The Timings command and the Timings Report
The ribbon for Aggregation matrices and Smart Columns includes a Timings command. When this is selected, the load time is added to the Results area.
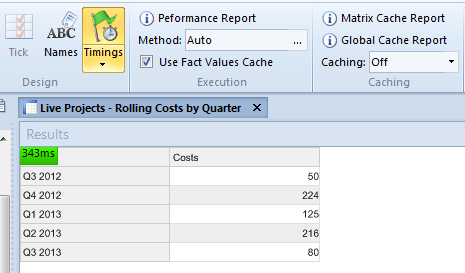
Whilst the load time gives a good general indication of performance, you can generate a report that breaks this timing down further. This gives you a much clearer indication of what is happening within your aggregation and where the inefficiencies might be. For example, you can see precisely how long the aggregation’s source query takes to execute.
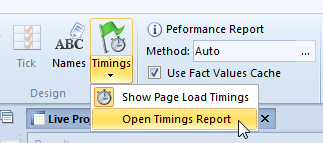
To generate this report, click the lower part of the Timings command, and then select Open Timings Report. This executes the aggregation and displays the report in your browser.
Here is a section of one report:
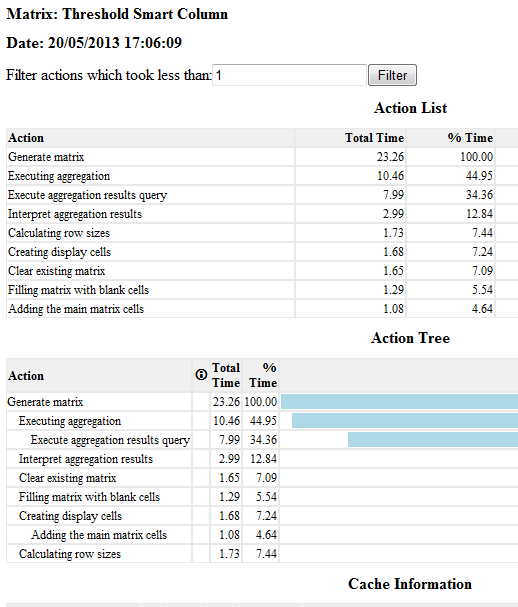
Timings are milliseconds, and you can filter out faster actions.
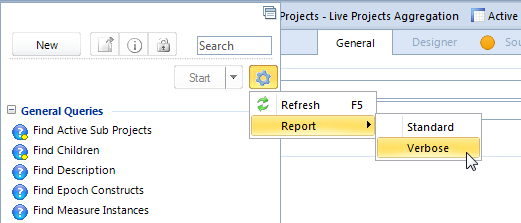
The Query reports that you generate from the cog icon on the Queries panel give general information on performance. As aggregations run as queries, these can be useful. They are also good reports for getting an overview of the queries and aggregations being used in a repository.
About Builds and upgrading
Continual performance improvements are being made to MooD 15. Make sure you are using the latest build available to you that is suitable for your Solution. In particular, use Build 60 or later.
As part of this, look in the release notes (or ask MooD International Support) to see if upgrade scripts are required. You may need to run a script against the database (repository) to get existing aggregations to work or perform better in a newer build. On the installation media, the release notes are always located in the MooD folder.
At the time of writing, you need to run a script if you are upgrading repositories created in:
- SQL Server Builds 42 to 56
- Oracle Builds 42 to 51
On the installation media, the upgrade scripts are always located in the MooD\Extras folder. Their names always refer to the database type and builds affected. Use the database administration software for your SQL Server or Oracle instance to execute the script against each repository affected. If you need assistance with this, contact MooD International Support.
Best practice
The first section below is an overview of best practice and a suggested workflow for the whole process of creating, testing and implementing aggregations. This is followed by sections giving more detailed best practice advice and suggestions covering:
- Creating aggregations (page 11). Primarily this covers Aggregation matrices, but much of the advice is relevant to Smart Columns.
- Implementing aggregations (page 12). Once you have aggregations you can take steps to improve their performance by controlling how they are implemented.
- Refactoring existing aggregations (page 13). If you have some aggregations that have been developed in earlier builds, it might be possible to improve their performance by refactoring certain aspects to make use of subsequently introduced features.
Best practice and workflow overview
What follows is our basic best practice guidelines and suggested workflow. The remainder of this document expands upon this and some additional features not introduced here. However, if you follow the points below, you’ll be well on your way to developing fast aggregations.
- Make sure you are using the latest build available to you that is suitable for your Solution, and that if you have upgraded, you have run any upgrade script required. See About Builds and upgrading on page 9 for details.
- Create your Aggregation matrix or Smart Column and incorporate it into your Solution. In general, the principles of good query design apply such as restricting the scope of the source query as much as possible. See the Best practice for creating aggregations section on page 11 for some specific advice.
- Decide whether aggregation caching is appropriate. If caching is appropriate, it is always a good idea to implement it.
- Test its performance. If possible, use representative data and variables.
- If you feel you need to improve performance, generate a Performance Report and see whether it recommends a particular execution method. Note that the recommendation will only have merit if you use representative data and variables. You also need to test execution methods with caching disabled. Once you have found the best execution method, you can enable caching again.
See the Best practice for implementing aggregations section on page 12 for more details on caching and execution methods.
In most cases, aggregations will perform well and you will not have to go beyond the decision on whether to use caching.
Finally in this overview, it should be noted that complex aggregations on large data sets will take time and performance assessments can be subjective. However, the guidance in this document should help you achieve the best possible performance across your aggregations.
Best practice for creating aggregations
Key advice during the creation phase is:
- Use the latest MooD build possible.
- Restrict the source query as far as possible (much of the general advice for efficient query development apply to aggregations as they share the same query engine). The standard query performance guidelines are in the next section.
- Try and restrict the number of variables that might be involved. Variables add to the permutations being processed.
o If you are going to implement caching, take note of any initial selections that you use and ensure that you at least cache the results for those variables. This will significantly improve your initial page load times.
- If you are going to have variables that will be set from drop-down controls in Active Enterprise, try and include them in the source query (as opposed to subsequent levels or dimensions).
- Where possible turn off totals in your dimensions and levels.
- Make sure the query is optimized (showing at each stage).
Query performance guidelines
The following guidance for faster queries is taken from the MooD 15 Getting Started Guide:
- The starting block should involve as few elements as possible. The most efficient starting point is the parameter, followed by elements, the results of query, and then type. The all elements except and everything settings are the least efficient.
o When using the parameter, use a where type condition to stop users executing queries over more elements than necessary. You should always try and restrict the breadth of a query.
- Conditions and their order can significantly affect performance. If a chain of conditions does not show the optimized icon at each point, experiment with their order and try to get the optimized parts of the query nearer the top of the chain. You can also attempt to restrict your query to conditions that lend themselves to optimized performance. These include:
o where conditions based on name (excluding measure instances), type, parent, children, reference, and the contents of simple type fields.
o Find blocks that find children, parents, descendants, and reference/referenced by.
When ordering conditions, put the following as early as possible in the query:
o AND conditions that are most likely to fail.
o OR conditions that are most likely to succeed.
- If using sub-queries, consider the performance of each, and pay particular attention to condition ordering when sub-queries are AND’d or OR’d together.
o And Finally blocks and the Take Top N condition can stop sub-queries being optimized.
- If possible, locate activated data constructs at the end of a query. Activated data is held externally and is slower to access. The less you need to access the better. Note that because of the introduction of aggregations in MooD 15, you are unlikely to use field activations.
Best practice for implementing aggregations
Key advice during the implementation phase is:
- Deploy on the latest MooD build possible.
- Consider whether caching is appropriate. The biggest performance gains come from caching. So, wherever possible, cache.
o Consider implementing a cache refresh regime using the Manage Aggregation Cache synchronizer. For example, if the data that the aggregation uses is uploaded monthly and does not change between uploads, consider deleting and recreating the cache immediately after the upload.
o The Manage Aggregation Cache synchronizer gives you a fine level of control over what variable permutations are included in the cache. If your models include aggregations or charts driven from aggregations that gather variables from the user, ensure that these possibilities are included in the cache. This will significantly improve your initial page load times.
It is very important to make sure that all variables are accounted for and included in any caching regime.
Note: To quickly see which Aggregation matrices aren’t cached, generate a Performance Report for all Aggregation matrices and look at its Time column. Cached matrices all have (cached) in this column.
- Consider whether setting a specific execution method is suitable. To determine this use the Performance Report command. However, note that for this to be of any use, you must use representative data and variables.
o You need to test execution methods with caching disabled. If you decide to test execution methods on a live site, make sure you switch caching back on when you are finished.
Note: Smart Columns do not use caching or execution methods.
Refactoring existing aggregations
As well as considering the general best practice given in the preceding sections (such as making sure you have run any upgrade script), consider the following when refactoring existing aggregations:
- Prior to Build 59, in Aggregation matrices, to get grand totals only, you had to add a totalling level and have that as the only visible level. Whilst this still works, in Build 59 onwards if you leave all levels hidden (unpinned), you get the grand totals. We recommend you remove totalling levels in existing Aggregation matrices.
- Prior to Build 59, MooD recommended replacing chains of hidden levels with single queries spanning those levels. In Build 59 onwards we recommend using levels as intended and replacing such queries in upgraded aggregations.
- Also consider whether you have written complex workarounds before these features were introduced:
o Build 58 introduced current date times in facts (as literal values or variables).
o Build 61 introduced the ability to find aggregated pick states in facts by means of a query.
o Build 52 introduced the ability to add levels that don’t exist in the source query, and better handling of nulls.
You are unlikely to be on a build earlier than 52.
If you would like to read more on this subject, please click on the attachment.
Comments
0 comments
Please sign in to leave a comment.