
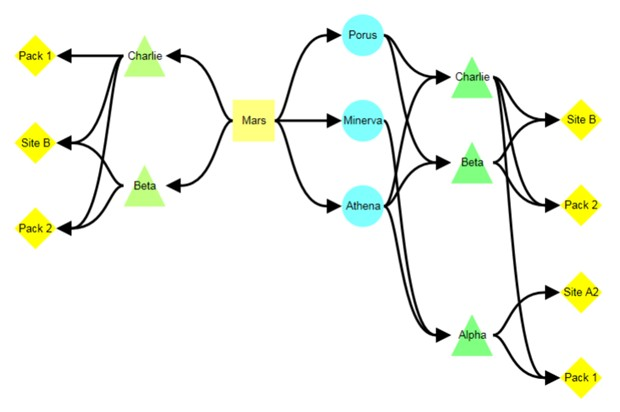
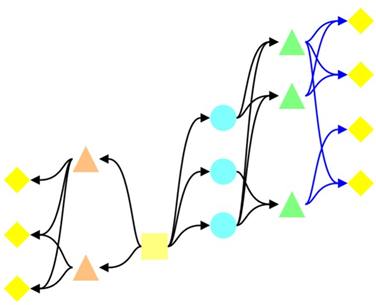
MooD 15 Build 86 includes the Network graph. From the subject element(s), this chart plots successive levels of related content. You can add related content to the left and right (or up and down if vertically aligned). For example, in this image, Mars is starting point and two levels have been added to the left and three to the right. Each level has its own formatting.
In Active Enterprise, users can drag nodes to change the display. However, users cannot move nodes within the hierarchy and any changes to the display are not saved. The algorithms and style settings that determine how the graph is presented will be reapplied on the next viewing. The Network graph has many similarities to the Radial chart which has been part of MooD 15 since the original release. The difference being that the Radial chart adds related content in one direction (outwards) from the central starting point and at runtime you can recentre the chart on another node. If you are already familiar with the Radial chart, the Network graph should pose no problems.
Note: You add relationships to the left or right edges of the graph. With the exception of the starting point, you cannot add two relationships, i.e. in the graph above you cannot add another branch from the level containing Porus, Minerva and Athena.
1. Configuring a Network graph
As with all charts, the Network graph is available from the Graphs gallery on a model’s ribbon (the Home tab), and configuration has two stages:
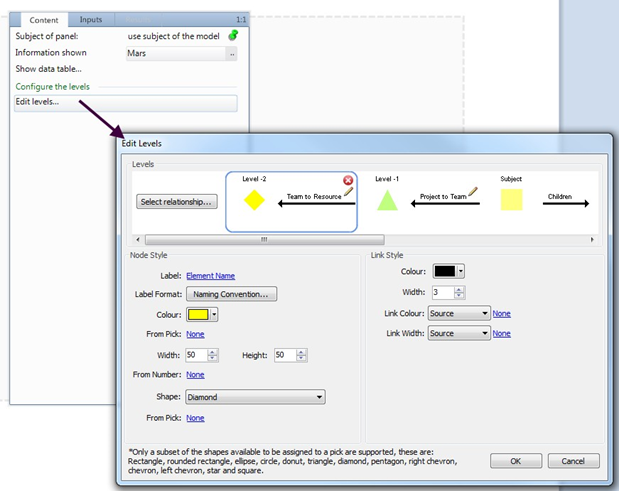
- Use the panel’s flipside to specify the graph’s content and some aspects of its appearance. From the flip side you access the Edit Levels dialog box where you specify the content and style for individual levels.
- Use the ribbon to refine the chart’s appearance. These settings apply to all the levels in the graph, for example the setting to switch between horizontal and vertical is on the ribbon. You cannot use the ribbon to format specific levels.
Known Issue: You may experience some delay in changes to settings being visually represented in Business Architect. There is a noticeable lag in the development workspace when some settings are changed.
2.1. Flipside Options –Content setup and Edit Levels
After placing a Network graph on a model, flip its panel to configure the content it will display. Set Information Shown, and then click Edit Levels. This displays the Edit Levels dialog box. Use this to define relationships to the left and or right of the subject element.
Key points about content configuration:
- By default, the element(s) returned by the Information Shown setting are displayed at the centre of the chart. In the Edit Levels dialog box, this is labeled Subject.
- In the Edit Levels dialog box, build the network graph by using the Select relationship buttons to the left and right of Subject.
o As you add levels, use the Node Style group of settings to format the node labels, colour, size and shape. Use the Link Style settings to style the links to the nodes at that level. The Levels gallery updates to display your styling.
o In the Levels gallery:
- Levels are numbered positive (right) and negative (left) from Subject.
- A border round a level shows you what level you are working on.
- You can delete the levels at either end of the graph, and edit the relationship at any level in the graph.
- If you select Subject, you can set its Node Style settings. The Link Style settings are not available for Subject as link styling is set in the target.
2.2. Ribbon Options – Refining appearance
Once you have a Network graph populated with content, use the ribbon to refine its appearance and behaviour in your solution. There are two tabs:
- Style – The general appearance of the graph. Most settings are on this tab.
- Text – Label formatting.
The following sections explain the key settings. In practice, you may have to use a degree of trial and error to get the appearance and behaviour you want.
2.2.1. Orientation
Choose between Horizontal (the default) and Vertical
2.2.2. Line Style
Choose between several line styles:
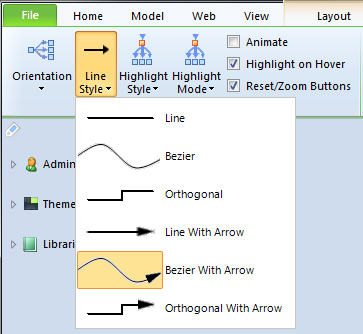
This line style applies to the whole graph. However, using the Edit Levels dialog box, at each level you can control the line width and colour.
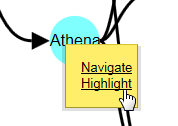
2.2.3. Highlight settings
There are several paths highlighting combinations available, to help Active Enterprise users understand a Network graph. If Highlight on Hover is not selected, you need to click on a node to see its path highlighting. If nodes are navigable (Allow Navigation on the Web tab), a popup lets users choose between Highlight and Navigate.
2.2.4. Animate
Select this to apply animation effects in Active Enterprise.
2.2.5. Reset/Zoom Buttons Whether to include a Reset and Zoom control in Active Enterprise.

This control is never shown in Business Architect.
2.2.6. Node Alignment settings
Use Parent to change how the parent node is aligned in relation to its children. It defaults to Centre, but can be Left or Right. In Horizontal orientation, Left translates to the bottom, and Right to the top. Indent is only available when Parent is set to Left or Right. This is an indent between levels and you can use it to display the graph on an angle. For example, this Horizontal graph is set to Left and Indent 40.
2.2.7. Node Layout settings
These settings give you broad layout styles and finer level control should you need it.
Style lets you choose between three out the box styles Standard, Compact and Expanded, and Custom that enables the Spacing and Expansion settings for you to set.
The Auto settings are particularly useful when the graph has many nodes with complex cross connections. When Auto is selected, any query or relationship ordering that would be applied to the nodes is ignored and the chart iterates through several drawing cycles to achieve an optimized spatial layout within that number of iterations. You can change the number of Iterations. The higher the number, the better the layout should be. However, this is at the expense of rendering speed. Center Connected will attempt to place nodes with the most connections towards the centre or the graph.
2.3. Text Tab
This tab lets you control the node text positioning and styling for the chart as a whole. The actual content of each level’s labels is set in the Edit Levels dialog box for that level. You can control the label positioning, font and format.
If you want to turn off all labels, set the font to No Text.
The Format check boxes affect node labels and only four permutations are supported. Note that in these images, the vertical alignment is set to Top.
With nothing selected:
With Word Wrap selected:

With Clip selected:

With Clip and Ellipsis selected:

2.3.1. Labels that say ‘null'
Note: This has been logged as Issue 10798.
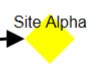
If, in the Edit Levels dialog box, you set Label to None, this evaluates to null and this is used as the label for all nodes at that level. For example:
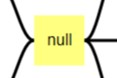
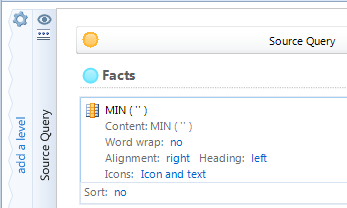
To stop this, set Label to a Smart Column with a string fact that returns an empty string. For example:
The Text tab on the ribbon only lets you disable labels for the entire graph. To disable labels for individual levels, use this workaround.
Comments
0 comments
Please sign in to leave a comment.