Bars
Opening the bars sections gives you access to the Chart style, Date range, and the formatting of the bars.
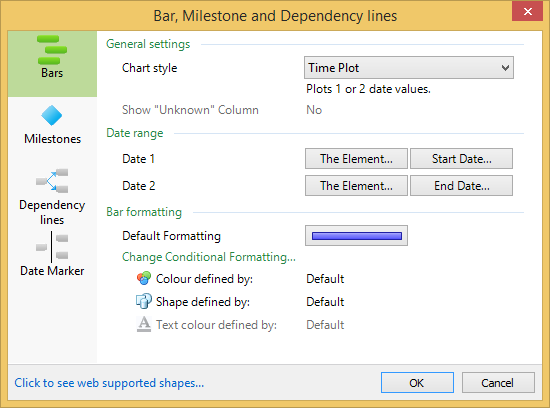
The Chart style allows you to swap between the different types of Timeline matrices - Timeline, Time Plot, and Information Against Time.
Timeline and Time Plot
A Timeline draws a bar between two dates forming a basic Timeline. If the dates are the wrong way around (the latter example is date first), the Matrix will display those values as 'time plots'.


A Time Plot draws two separate bars corresponding to two dates.

How to Create a Timeline/ Time Plot Chart
- Open the Bar, Milestone and Dependency lines dialogue box.
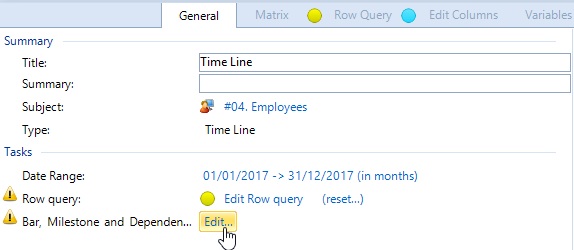
- In the Bars tab, change the Chart style to 'Timeline'/'Time Plot'.
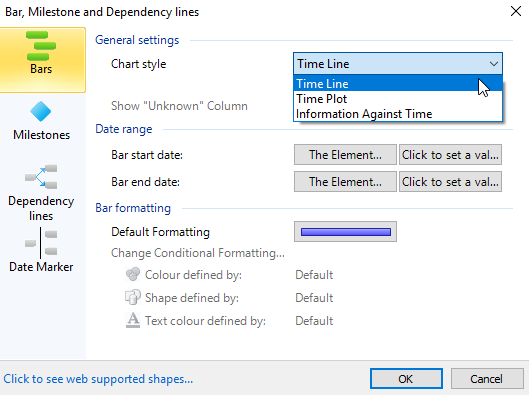
- Click on the button next to 'Bar start date:' / 'Date 1' to set the value location i.e. where the date information comes from.
- By default this will be 'The Element'.
- Click 'Click to Set a Value' to add the date field the Elements will use as the starting point for the bars.
- Repeat steps 3 and 4 for 'Bar end date:' / 'Date 2'.
- Click on the blue bar next to 'Default Formatting' to change the styling of the timeline bars.
- Click 'OK'.
Creating a timeline/time-plot chart is demonstrated in the short clip below:
Information Against Time
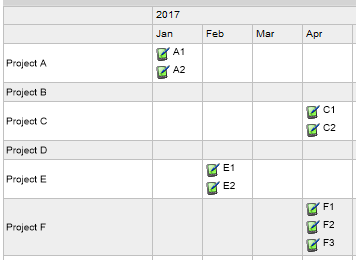
Information Against Time plots related information about an Element into one of the date columns.
For example, you could plot the start date of a project, and populate it with the employees that will be working on the project.
How to Create an Information Against Time Chart
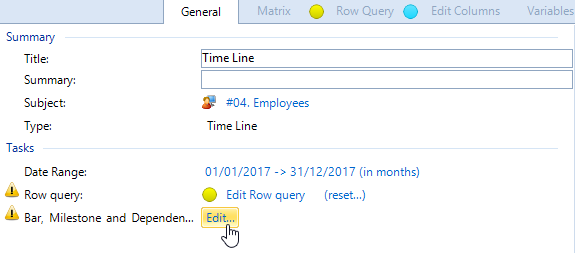
- Open the Bar, Milestone, and Dependency lines dialogue box.
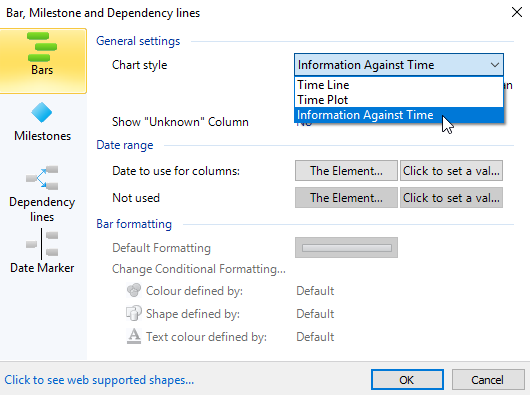
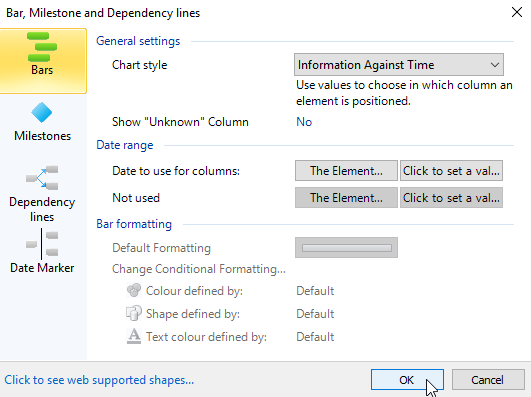
- In the Bars tab, change the Chart style to 'Information Against Time'.
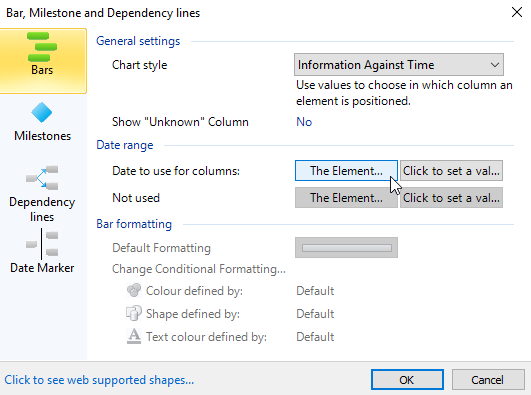
- Click on the button next to 'Date to use for columns:' to set the value location, i.e. where the date information comes from. By default this will be 'The Element...'
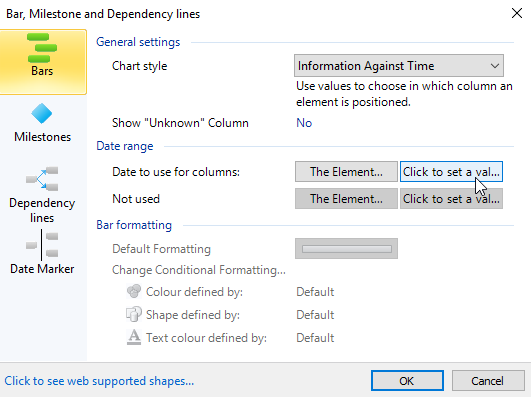
- Click 'Click to Set a Value' to add the date field the Elements will use to decide which column to populate.
- Click 'OK'.
- Change the information shown in the cells of the matrix by selecting 'Edit...' next to Cell display in the Tasks section.The default is 'This Element'.
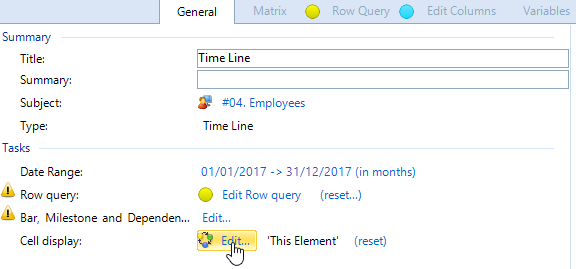
- Select the information you want to display in the cells by using the 'Select Content' dialogue box.
Creating an Information Against Time chart is demonstrated in the video clip below:

Comments
0 comments
Please sign in to leave a comment.