Timeline Matrix
Timeline Matrices display elements as rows, and plot information against a timeline. Each timeline is derived from the date fields allocated to an element. Queries are used to select the row headers, and also, in the case of the cell query starting point, the column headers and cell content.
Datasheet columns can be added, containing fields such as pick lists; numbers; dates; related elements; results of a Query; Smart Column values etc.

How To Create a Timeline Matrix
|
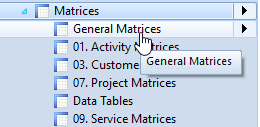
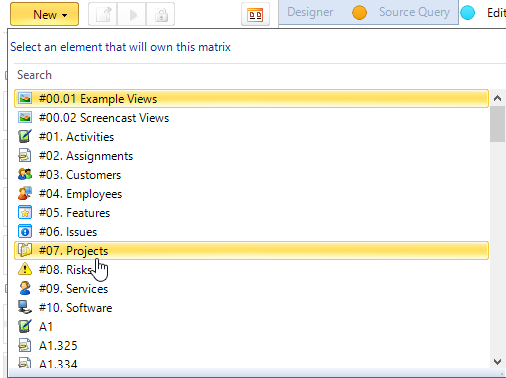
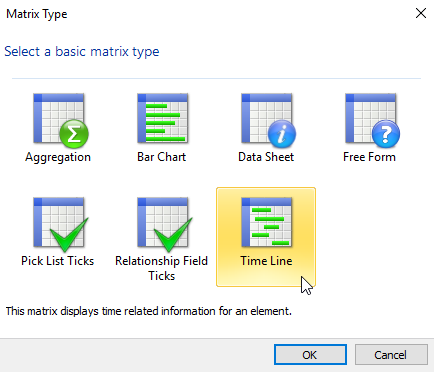
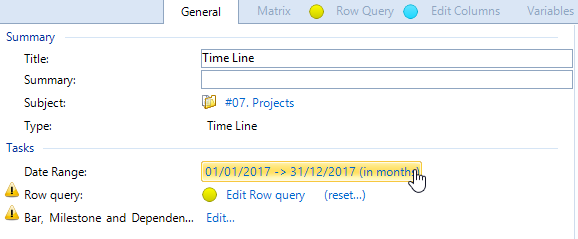
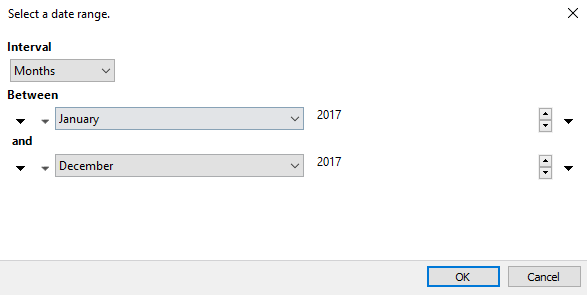
1. Expand out the Matrix library in the Explorer bar 2. Select the group the Matrix will be located in - the default option is General Matrices 3. Click "New" and select an Element to own the Matrix 4. Select Timeline in the Matrix Type popup and click "OK" 5. Give the Matrix a name and a quick summary 6. Choose the type of Timeline Matrix by changing the starting point. The default is the Row Query starting point. Under "Tasks", click on the current date range and use the "Select a date range" dialogue to change it.
9. Click on the links to edit the Queries. The links available depend on the Starting Point selected: |
|
|
Row Query Starting Point |
Cell Query Starting Point |
|
a) Click "Edit Row Query" b) Construct a Query that finds the row header Elements |
a) Click "Edit Cell Query" b) Construct a Query that finds the Elements that will populate the cells c) Optionally, click "Edit Cell to column query" and "Edit Cell to row query" d) Construct Queries which find the column/row header Elements from the cell Elements
|
|
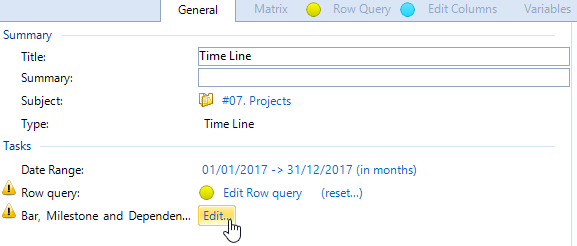
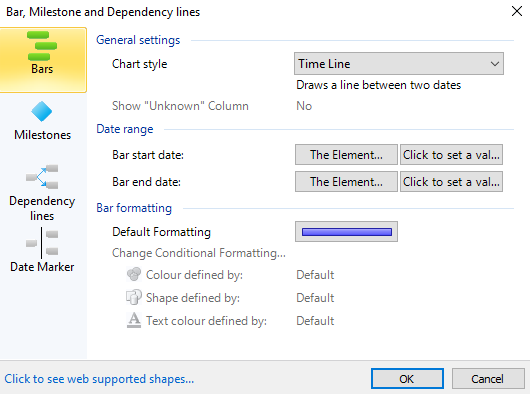
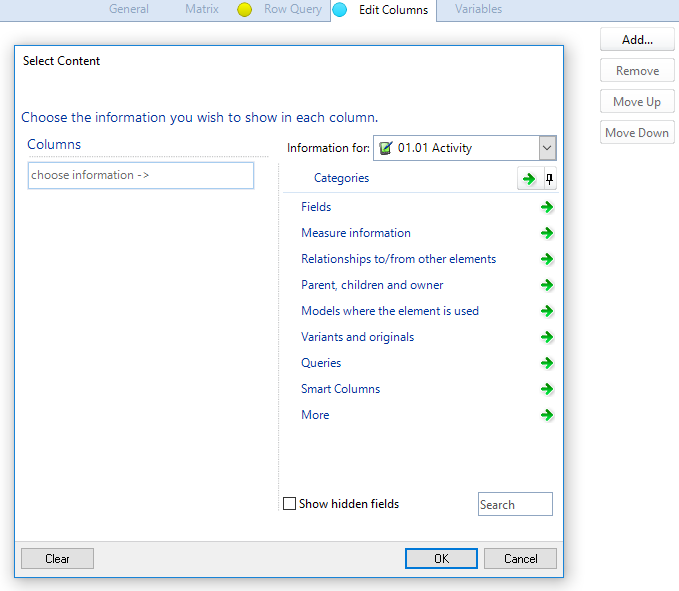
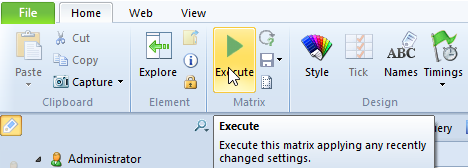
1. Next to 'Bar, Milestone, and Dependency…', click "Edit…" 2. Use the 'Bar, Milestone, and Dependency lines' dialogue box to add the content you want to see plotted on the Matrix. 3. Add datasheet columns to your Matrix as required. 4. Click "Execute" on the Home tab in the ribbon to see your Matrix.
|
|
Creating a timeline matrix is demonstrated in the short video clip shown below:



Comments
0 comments
Please sign in to leave a comment.