Administrators of MooD Web sites, can visit <site>/status.aspx to view reports on the health of the current Active Publisher application.
A new section has been added which shows statistics of queries executed during the uptime of the application pool, for all worker threads MooD generated. This includes Smart Columns, Aggregation Matrices, individual MooD Queries, and MooD Queries executed on behalf of normal MooD Matrices.
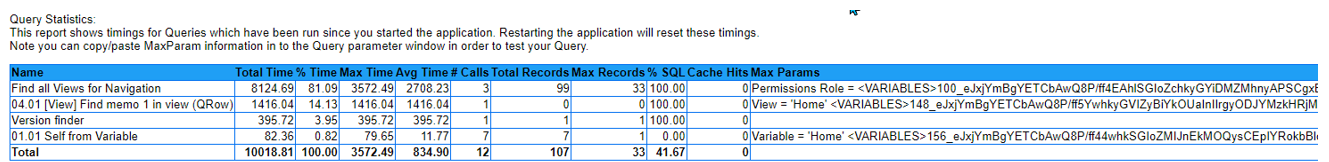
The columns Administrators will see are as follows:
Total Time
The aggregated sum of the time taken by this query to execute. High numbers may be a cause of concern.
% Time
The percentage of time spent processing this query compared to other queries processed.
Max Time
The longest time this query took to execute. Sometimes queries take longer to execute the first time. Low numbers are good.
Avg Time
The average time taken to execute this query. Low numbers are good.
# Calls
The number of times this query has been executed.
Total Records
The accumulation of all records returned by all executions of the query. Low numbers are good.
Max Records
The maximum number of records returned by any execution of the query. Low numbers are good.
% SQL
The amount of the query which was converted into direct SQL statements, and not procedurally iterated. 100% is good.
Cache Hits
The number of times the query results were retrieved from cache rather than from the database. This only applies to cached queries. Parameter changes to queries will result in fewer cache hits, so you will not expect a near 1:1 ratio of #Calls to Cache Hits.
Max Params
Each query may execute with different parameters. This column is an XML fragment which represents the variables used which caused the largest Max Time execution of the query.
Administrators can copy the XML text
<VARIABLES>encoded data</VARIABLES>
and paste this into the query window's Test feature to replicate which variables were being used at runtime.
Limitations
These statistics do not persist between application pool recycles, or Internet Information Service restarts.
Some Single and Multiple Element Picker queries are not reported.
Queries which are executed via the Business Integration Engine (most Synchronizers) are not reported.
Business Architect driven executions are not reported, however you can already view those from the Repository Explorer.
This feature was introduced in 16.082
Comments
0 comments
Please sign in to leave a comment.