Briefly, what is a Free Form matrix?
A Free Form matrix displays elements on both the X and Y axis. These elements are related by a query, and the cells can show information from those elements or from related elements. It is the most flexible matrix in MooD. This flexibility brings complexity. A Free Form matrix is constructed using queries. The key to using it is to understand clearly what you want to show in the matrix, and whether your repository has the data and relationships required to produce the queries needed. Knowing what you want to show in a table is central to successfully implementing any matrix, but this is particularly true of the Free Form matrix.
What sort of tables is it suitable for?
Because of its flexibility, any type of table. However, it is particularly suited to tables where you want to show the relationships between groups of elements and not just data values. This is best illustrated by two examples that show relationships between Task, Team and Project elements.
This first example has Projects as rows, and then shows the different Teams assigned to Tasks..
In this next example, the cells show Projects and the Pick list status for an applied measure.

Key details
Three starting points (the three basic configurations available)
Free Form matrices all start with a query. However, you choose between three starting points: a Row query, a Column query, or a Cell query. The Free Form matrix tab has a Change button to cycle between them. Each starting point gives you a different type of table, and a different sequence of queries to construct it. The sections that follow outline each starting point.
The Row query starting point
This adds the rows first. After this you add a Cell to column query to add the columns and position elements against them. This second query starts from a row element.
On the General tab for a Free Form matrix, this is the default starting point and it appears as:

(Query sequence: Row > Cell to column)
Note: For each query in the sequence, there is a sub tab within the main tab. For example, for a Free Form matrix that starts with a Row query, you have these tabs:

This type is ideal when you know what elements you want to show as rows. From this starting point, you then find the elements for your columns, and configure the cells to show some relationship between the two.
For example, as shown in the following image, show Projects as rows, then find Tasks as columns, and in the cells show what resources (if any) are allocated.

The Column query starting point
This adds the columns first. After this you add a Cell to row query to add the rows and position elements amongst them. This second query starts from a column element. The icon for this is:

(Query sequence: Column > Cell to row) This starting point is the inverse of the Row query starting point. Choosing between them is a presentation choice, not a logical or content choice. For example, here is the previous example but with the Project elements added as columns:

The Cell query starting point
This is the most complex starting point. It lets you define a query that finds elements to use as cells, and then lets you define two queries (Cell to Column and Cell to Row) to add the columns and rows by which those elements are positioned within the table. Both these queries start from a cell element. The icon for this is:
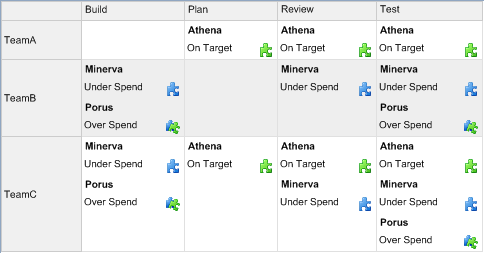
 (Query sequence: Cell >Cell to column > Cell to row) This starting point is ideal for where you want cells to show elements and some information related to that element. For example, the following shows Project elements and a Measure status for different Teams and Tasks.

The Cell query starting point is also useful when you want one of the axes to show epochs. For example:

This second example:
- Starts with a Cell query that finds measure instances.
- Then has a Cell to column query that finds and orders their epochs (specifically a Find Instances Epoch block followed by an And finally block with an order by clause).
- Ends the query sequence with a Cell to row query that finds the Project elements that contain the measure instances (a Find Instances Container Element block).
- Finally, the Cell display setting is configured to show the value of the measure instance within each cell.
Cell display (Controlling what appears in the cells)
For all three types of Free Form matrix, once you have completed the queries to get the content, use the Cell display setting to control what is actually shown in the cells. This setting is the last setting under Tasks on the General tab. Click Edit to display a Select Content dialog box.

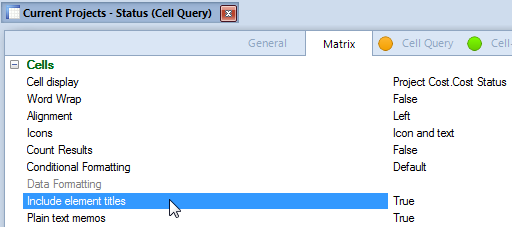
If the matrix starts from a Cell query, the cells can include or exclude the name of the elements they contain. This setting (Include element titles) is on the Matrix sub tab, within the Cells group, as shown in the next image:

Auto-generate columns and rows by default
Once you add a Cell to query, the columns or rows included in the table are added automatically based on the content returned by that query. In many cases, MooD’s selection will be what you want. However, if it isn’t, you can switch off the auto generation and manually write another query to find exactly what you want. For example, if the auto generation includes too many columns, you can replace it with a query that finds just the required columns. As soon as you switch off auto generation, you get a new sub tab for the replacement query. How to do this for a Row query Free Form matrix is outlined next.
On the Matrix tab, in the Columns group, there is an Auto-generate columns setting that defaults to True.

When False, the query sequence for the Row query Free Form matrix changes from Row > Cell to column to Row > Column > Cell to column, and a Column Query sub tab is added to the main tab, as shown here:

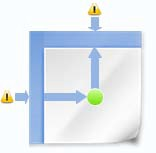
The image that represents this configuration also changes to:

Use the new Column Query sub tab to replace the automatically generated columns. At the expense of an additional manual step, this gives you complete control over what columns appear in your matrix.
There are equivalent Auto-generate settings for the other two types of Free Form matrices. They function in the same manner. For example, for a Cell query (the third starting point), if you set both Auto-generate rows and Auto-generate columns to False:
- The query sequence becomes: Row > Column > Cell > Cell to column > Cell to row.
- You have five sub tabs:

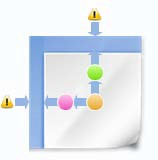
- The image that represents this particular configuration becomes:

Note: This document does not elaborate further on these extended configurations. They add flexibility should you require it.
If you'd like to read more on this matter, please click on thye attachment.
Comments
0 comments
Please sign in to leave a comment.